Reference
Chapman, W.L. and Walsh, J.E. 2007. A synthesis of Antarctic temperatures. Journal of Climate 20: 4096-4117.
What was done
Monthly surface air temperatures from manned and automatic weather stations along with ship/buoy observations from the high-latitude Southern Hemisphere were used to develop a gridded database with resolution appropriate for applications ranging from spatial trend analyses to climate change impact assessments. The data came from a total of 460 locations in the Southern Hemisphere. Temperatures over land were obtained from 19 manned stations of the World Monthly Surface Station Climatology network, most of which were located in coastal areas of the Antarctic continent, plus 73 stations of the Automated Weather Station network, many of which were situated further inland. Temperatures over the sea were obtained from the International Comprehensive Ocean-Atmosphere Data repository. Of particular importance in their melding of these diverse data, the authors used correlation length scaling "to enhance information content while limiting the spatial extent of influence of the sparse data in the Antarctic region."
What was learned
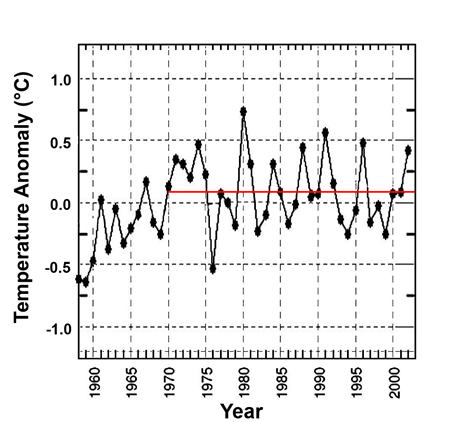
Chapman and Walsh's final results are presented in the figure below.
Annual surface air temperature anomalies relative to the 1958-2002 mean for the region of the Southern Hemisphere extending from 60 to 90°S. Adapted from Chapman and Walsh (2007).
What it means
The data in the figure above clearly indicate a post-1958 warming of Antarctica and much of the surrounding Southern Ocean. From approximately 1970 to the end of the record, however, temperatures of the region simply fluctuated around an anomaly mean of about 0.12°C, neither warming nor cooling over the final 32 years of the record.
This latter observation is truly amazing in light of the fact that the region of study includes the Antarctic Peninsula, which experienced phenomenal warming during this period. Nevertheless, the mean surface air temperature of the entire region changed not at all, over a period of time that saw the air's CO2 concentration rise by approximately 47 ppm (about 15% of its 1970 value, as per the Mauna Loa CO2 record).
Clearly, the entire continent of Antarctica, together with much of the Southern Ocean that surrounds it, has been completely oblivious to the supposedly "unprecedented" radiative impetus for warming produced by anthropogenic emissions of CO2 and other greenhouse gases over the last three decades of the 20th century ... and even a bit beyond.
Reviewed 19 December 2007


