


Reference
Wiles, G.C., Krawiec, A.C. and D'Arrigo, R.D. 2009. A 265-year reconstruction of Lake Erie water levels based on North Pacific tree rings. Geophysical Research Letters 36: 10.1029/2009GL037164.
Background
Climate alarmists have long "worried" that "increased evaporation under a possible greenhouse-enhanced climate, coupled with even more consumptive use of the Great Lakes waters, could lead to lower lake levels in the near future," as noted by Larson and Schaetzl (2001), while Changnon (2004) has stated that "recent shifts in lake levels [have] led to a major disaster-oriented assessment of the 'record' declines in recent years," stating that certain people have "attributed these to climate change from global warming." In this regard, he makes particular mention of the National Geographic Society, which in 2002 ran an article entitled "Down the Drain? The Incredible Shrinking Great Lakes" in their flagship publication National Geographic.
What was done
Wiles et al. compared eighteen temperature sensitive ring-width series of trees from the Gulf of Alaska region with monthly Lake Erie water levels over a common period of 87 years, deriving a good relationship between the ring-width series and mean annual lake levels, after which the four ring-width series found to be most highly correlated with the Lake Erie water levels were used to extend the total length of the lake level history to 265 years."
What was learned
The results of the researchers' analysis are presented in the figure below, where it can be seen, as they state, that "reconstructed extremes have approached but not exceeded the late 20th century high levels [our italics]." And in the concluding sentence of the abstract of their paper, they reiterate that "the highest lake levels in the reconstruction are found over the past few decades."
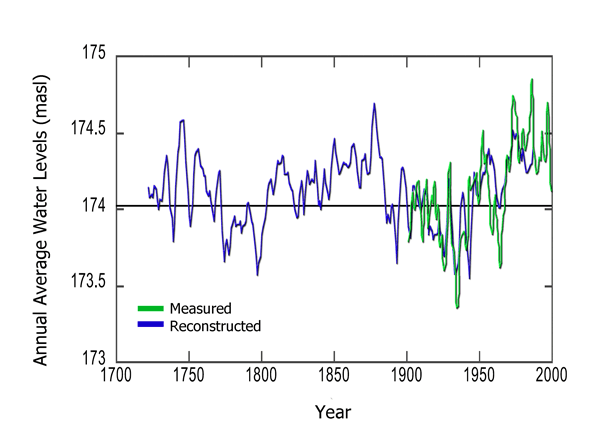
Annual mean water level of Lake Erie vs. time, as directly measured (green line) and reconstructed (blue line). Adapted from Wiles et al. (2009).
What it means
So how has it happened? In discussing their findings, Wiles et al. remark that "the recent higher stands in the 1970s-1990s, and perhaps the steady rise in lake levels over the past 100 years, may be linked to a rise in Gulf of Mexico-derived precipitation that has generally outpaced increased evaporation," and they report that "similar increases in precipitation and humidity have been noted for Lake Michigan (Sellinger et al., 2008) and relative humidity in the general lower Great Lakes regions (LaValle et al., 2000)." Once again, therefore, we have another example of model-based climatic concerns ultimately being replaced with real-world good news.
References
Changnon, S.A. 2004. Temporal behavior of levels of the Great Lakes and climate variability. Journal of Great Lakes Research 30: 184-200.
Larson, G. and Schaetzl, R. 2001. Origin and evolution of the Great Lakes. Journal of Great Lakes Research 27: 518-546.
LaValle, P.D., Lakhan, V.C. and Trenhaile, A.S. 2000. Short term fluctuations of Lake Erie water levels and the El Niño/Southern Oscillation. Great Lakes Geography 7: 1-8.
Sellinger, C.E., Stow, C.A., Lamon, E.C. and Qian, S.S. 2008. Recent water level declines in the Lake Michigan-Huron system. Environmental Science and Technology 42: 365-373.
Reviewed 13 May 2009