


Volume 5, Number 43: 23 October 2002
Carbonyl sulfide or COS is the most abundant tropospheric sulfur gas on earth (Aydin et al., 2002). With an atmospheric lifetime on the order of two to seven years (Xu et al., 2002), it has a complex biogeochemical cycle with a number of natural sources and sinks involving both the oceans and the terrestrial biosphere (Andreae and Crutzen, 1997). In addition, it is believed that approximately one-fourth of the tropospheric burden of COS is produced by anthropogenic activities (Watts, 2000).
Across the oceans from which naturally-produced COS is emitted to the air, surface-water COS concentrations are highly correlated with surface-water primary productivity (Andreae and Ferek, 1992). So strong is the correlation, in fact, that Erickson and Eaton (1993) developed an empirical model for computing ocean-surface COS concentrations that requires inputs of only surface-water chlorophyll concentrations and values of incoming solar radiation.
An even greater portion of the naturally-produced COS is created in the atmosphere, where carbon disulfide and dimethyl sulfide - largely of oceanic origin (Aydin et al., 2002) - undergo photochemical oxidation (Khalil and Rasmussen, 1984; Barnes et al., 1994). Consequently, this component of the tropospheric burden of COS is also ultimately dependent upon photosynthetic activity occurring near the surface of the sea.
So why do we care? We care because carbonyl sulfide, in the words of Xu et al. (2002), "can be transported into the stratosphere and there [be] photochemically oxidized to eventually form sulfate particles." Furthermore, as they continue, "this process may significantly contribute to stratospheric background aerosol," as demonstrated by Crutzen (1976) and Engel and Schmidt (1994). And stratospheric aerosol particles - especially sulfate particles - are highly effective in reflecting incoming solar radiation back to space and thereby cooling the planet (Charlson et al., 1990).
We also care because the study of Aydin et al. (2002) strongly suggests that the mean tropospheric COS concentration has risen by approximately 30% since the 1600s, from a mean of 373 ppt over the period 1616-1694 to 485 ppt today. This is a sizeable increase; and Aydin et al. note that only a fourth of it can be attributed to anthropogenic sources. The rest of the observed COS increase, therefore, must have had a natural origin, a large portion of which must have ultimately been derived from the products and byproducts of marine photosynthetic activity; and this observation raises the question of what has been responsible for the increase in oceanic primary production required to provide the bulk of the large difference between the measured increase in COS and the increase provided by anthropogenic sources.
If you are a regular reader of CO2 Science Magazine, you can probably guess by now what we are about to propose as a working hypothesis, i.e., that the increase in the air's CO2 concentration between the beginning and end points of the time period in question - possibly augmented by the warming the earth experienced during its recovery from the global chill of the Little Ice Age - has altered the magnitudes of COS sources and sinks in such a way as to produce the extra carbonyl sulfide that has accumulated in the atmosphere over this time interval.
As a first step in exploring this hypothesis, we have plotted the air's COS concentration as a function of atmospheric CO2 concentration over the period in question, as shown in the figure below. The first of the three points on this graph is derived from the mean 1616-1694 COS concentration (372.8 ppt) derived by Aydin et al. and the corresponding mean CO2 concentration (276.5 ppm) derived from the data of Etheridge et al. (1998). The second point is derived from Aydin et al.'s declaration that "recent measurements of COS in South Pole firn air suggest that atmospheric levels of COS were 400 ppt at around 1920 [Stephen A. Montzka, personal communication]" and the CO2 concentration for that year (299.7 ppm) derived from the results of several different CO2-vs-time data sets assembled by Idso (1989). The third point is derived from another Montzka-based statement of Aydin et al., which affirms that recent measurements point to "annual mean mixing ratios for COS of around 485 ppt in both hemispheres" and the current mean CO2 concentration of approximately 370 ppm.
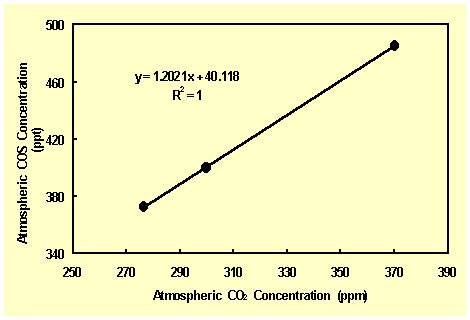
As the figure above clearly demonstrates, the three data points describe a perfect linear relationship, which is what would be expected for at least the anthropogenic-induced component of the increase in COS, since the increase in atmospheric CO2 concentration arises from the same anthropogenic activities that are responsible for the COS increase. With respect to the three-times-larger naturally-induced component of the COS increase, however, it is difficult to say whether a linear relationship should have been expected, due to the great uncertainty surrounding the several source and sink terms of the global COS budget (Andreae and Crutzen, 1997). Nevertheless, the linear relationship of the figure is what it is: a substantial basis for suggesting that the increase in atmospheric CO2 concentration since preindustrial times is the ultimate cause of the concomitant increase in atmospheric COS concentration. As such, it should serve as the starting point for further investigations of this phenomenon, which could well prove to be an important negative-feedback force for counteracting the impetus for warming provided by the historical increase in atmospheric greenhouse gas concentrations.
| Sherwood, Keith and Craig Idso |
Reference
Andreae, M.O. and Crutzen, P.J. 1997. Atmospheric aerosols: Biogeochemical sources and role in atmospheric chemistry. Science 276: 1052-1056.
Andreae, M.O. and Ferek, R.J. 1992. Photochemical production of carbonyl sulfide in seawater and its emission to the atmosphere. Global Biogeochemical Cycles 6: 175-183.
Aydin, M., De Bruyn, W.J. and Saltzman, E.S. 2002. Preindustrial atmospheric carbonyl sulfide (OCS) from an Antarctic ice core. Geophysical Research Letters 29 (9): 10.1029/2002GL014796.
Barnes, I., Becker, K.H. and Petroescu, I. 1994. The tropospheric oxidation of DMS: a new source of OCS. Geophysical Research Letters 21: 2389-2392.
Charoson, R.J., Langner, J. and Rodhe, H. 1990. Sulphate aerosol and climate. Nature 348: 22.
Crutzen, P.J. 1976. The possible importance of CSO for the sulfate layer of the stratosphere. Geophysical Research Letters 3: 73-76.
Engel, A. and Schmidt, U. 1994. Vertical profile measurements of carbonlysulfide in the stratosphere. Geophysical Research Letters 21: 2219-2222.
Erickson III, D.J. and Eaton, B.E. 1993. Global biogeochemical cycling estimates with CZCS satellite data and general circulation models. Geophysical Research Letters 20: 683-686.
Etheridge, D.M., Steele, L.P., Langenfelds, R.L, Francey, R.J., Barnola, J.-M. and Morgan, V.I. 1998. Historical CO2 records from the Law Dome DE08, DE08-2, and DSS ice cores. In Trends: A Compendium of Data on Global Change. Carbon Dioxide Information Analysis Center, Oak Ridge National Laboratory, Oak Ridge, TN, U.S.A.
Idso, S.B. 1989. Carbon Dioxide and Global Change: Earth in Transition. IBR Press, Tempe, AZ, USA.
Khalil, M.A.K. and Rasmussen, R.A. 1984. Global sources, lifetimes, and mass balances of carbonyl sulfide (OCS) and carbon disulfide (CS2) in the earth's atmosphere. Atmospheric Environment 18: 1805-1813.
Watts, S.F. 2000. The mass budgets of carbonyl sulfide, dimethyl sulfide, carbon disulfide and hydrogen sulfide. Atmospheric Environment 34: 761-779.
Xu, X., Bingemer, H.G. and Schmidt, U. 2002. An empirical model for estimating the concentration of carbonyl sulfide in surface seawater from satellite measurements. Geophysical Research Letters 29 (9): 10.1029/2001GL014252.