


The Need for Long-Term Experiments
Volume 6, Number 10: 5 March 2003
When I joined the USDA's Agricultural Research Service in June of 1967 as a new Ph.D., I was an impatient sort of soul. I worked on a number of different problems and was in a hurry to tell the world everything I learned about them. Hence, I published a lot of scientific articles about a lot of different things; but most of what I did in those early years was not of a long-term nature, and I was sometimes criticized for that fact. Since I was successful at what I did, however, I was not impressed to change my ways; and I would probably still be operating at that fast-paced mode but for the simple fact that in July of 1987, after 20 years of intensive but short-term research ... I planted a tree.
Actually, I planted eight trees; and it was my technical assistant (Michael G. Anderson, a graduate student) who did most of the work. The little seedlings we had ordered were so small that they came to us in a cardboard box with their roots packed in sphagnum moss. After planting them at what we felt were appropriate intervals along an east-west transect behind the Western Cotton Research Laboratory -- which is located next to the U.S. Water Conservation Laboratory in Phoenix, where we worked -- my technician and several others built four clear-plastic-wall open-top chambers that enclosed the trees in pairs. Then, after allowing the trees to establish themselves over a four-month period, and in a collaborative effort with Dr. Bruce Kimball, we began in mid-November of that year (1987) to enrich the air within two of the chambers with an extra 300 ppm of CO2 via the automatic CO2 sampling and control system described by Kimball et al. (1983) and Idso et al. (1984), while the other two chambers were maintained at the local ambient concentration of approximately 400 ppm CO2.
From that point on, until the present day, we (actually our technician Stephanie Johnson) have measured the circumferences of the trunks of the trees at a specified height above the ground at the midpoint of each month (Idso et al., 1991). Also, at the conclusions of the second and third years of the study, we measured the lengths of the trees' trunks and all of their branches; and at 10-cm intervals we measured the diameters of the trunks and branches, which enabled us to calculate the total trunk plus branch volume of each tree and thereby develop a relationship between that parameter and trunk circumference (Idso and Kimball, 1992). Then, over a number of subsequent years, we periodically removed a few branches from each of the trees and determined their densities, which allowed us to calculate the total trunk plus branch biomass of each tree from our monthly measurements of trunk circumference (Idso and Kimball, 2001).
Figure 1 depicts the changing ratio of the aboveground wood biomass of the CO2-enriched trees to that of the ambient-treatment trees over the first two years of our study. At the start of the experiment, the trees of the two treatments were of the same size, yielding an aboveground wood biomass ratio of unity; but the trees exposed to the extra 300 ppm of CO2 (a step increase of 75%) rapidly grew to contain twice and then three times as much total aboveground wood biomass as the trees exposed to ambient air.
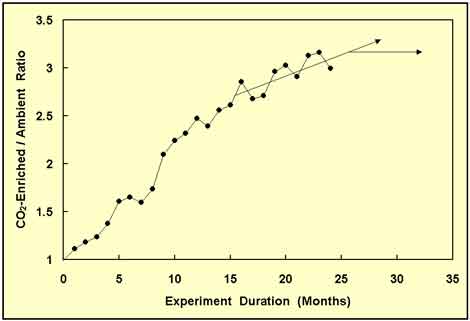
Figure 1. The CO2-enriched/ambient-treatment ratio of total aboveground sour orange tree wood biomass plotted as a function of time since the start of the experiment, along with arrows that depict what would seem to be logical projections of what might happen to this ratio if the experiment were to be continued beyond the last point shown. Adapted from Idso and Kimball (2001).
At the conclusion of 1989, twenty-four months into the experiment, our study had evolved into one of the longest I had ever conducted. Was there a need to continue it even longer? From the data of Figure 1, it could reasonably be assumed that the CO2-enriched/ambient-treatment wood biomass ratio might possibly rise a little higher, but that it had to level off sometime soon. Hence, we decided to continue collecting data just a tad longer, in order to determine the long-term asymptotic growth response of the trees that were exposed to the extra CO2; and after seven more months, we obtained the results that are plotted in Figure 2.
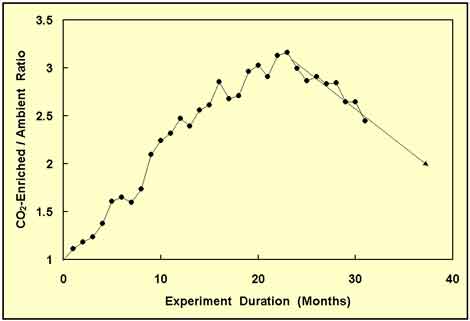
Figure 2. Same as Figure 1, but with seven additional months of data and a new projection of the CO2-enriched/ambient-treatment wood biomass ratio. Adapted from Idso and Kimball (2001).
To our surprise -- and, I must admit, my chagrin -- the wood biomass ratio not only did not rise any higher, or even level out, it began a steep decline. And projecting forward in time, it appeared that if the new trend continued, all of the biomass advantage acquired by the CO2-enriched trees might well disappear over the next couple years. Clearly, we had to continue the experiment, which we did, obtaining the additional data depicted in Figure 3.
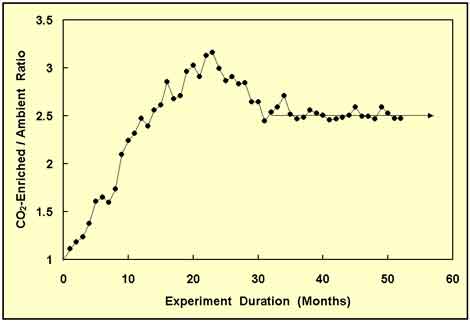
Figure 3. Same as Figure 2, but with 21 additional months of data and a new projection of the wood biomass ratio. Adapted from Idso and Kimball (2001).
The results portrayed in Figure 3 were extremely gratifying. They suggested that after an initial "overshoot" of the long-term response of the trees to atmospheric CO2 enrichment, things had finally settled down and we had obtained the answer we had been seeking: the ultimate equilibrium response of the trees, which was a whopping 150% increase in wood biomass production in response to a 75% increase in the air's CO2 concentration. For some reason, however, we continued collecting data, only to be surprised once again, as we obtained the results depicted in Figure 4.
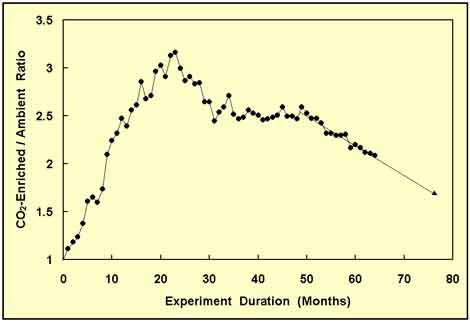
Figure 4. Same as Figure 3, but with 12 more months of data and yet another projection of the CO2-enriched/ambient-treatment wood biomass ratio. Adapted from Idso and Kimball (2001).
After having maintained a near-constant value for over a year and a half, the wood biomass ratio began to decline again, as shown in Figure 4, not as rapidly as it had the first time, but nevertheless at a substantial rate. And as it dropped ever lower, my prior euphoria gave way to consternation. Still, we persisted in collecting data, hoping for yet another change; and we found it, as shown in Figure 5.
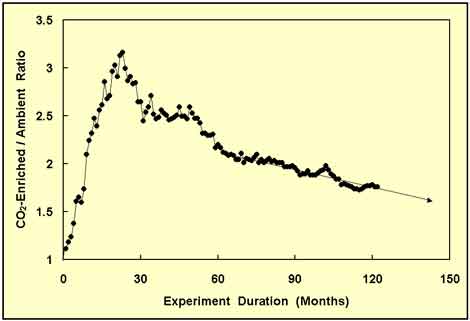
Figure 5. Same as Figure 4, but with 58 months of additional data and one more projection of the CO2-enriched/ambient-treatment wood biomass ratio. Adapted from Idso and Kimball (2001).
This time, the change was to a reduced rate of decline in the wood biomass ratio, as shown in Figure 5; and it persisted for nearly five years. By now, our experiment had passed the decade point; and it looked like the wood biomass ratio was going to continue to slowly decline and probably approach some asymptotic limit that might not be much greater than unity. Resigned to seeing things through to the bitter end, however, we continued collecting data, obtaining the results portrayed in Figure 6.
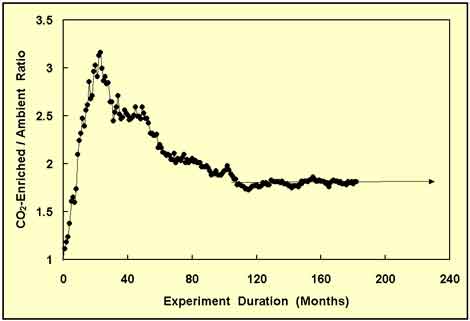
Figure 6. Same as Figure 5, but with 60-plus months of additional data and one last projection of the wood biomass ratio. Adapted from Idso and Kimball (2001).
As time has progressed and our experiment has moved beyond the 15-year point of duration -- making it the longest study of its kind ever to be conducted anywhere in the world -- we are once again beginning to believe we may well have found what eluded us throughout the entire first decade of data collection, i.e., the ultimate long-term equilibrium response of the trees to atmospheric CO2 enrichment. Why? Because for the past 80 long months, as shown in Figure 6, the wood biomass ratio has hovered very close to a value of 1.80, indicative of an 80% increase in aboveground wood biomass production in response to a 75% increase in the air's CO2 content. And it just seems to us that that response is not going to change from here on out.
But is this truly the final and unchanging answer? We think that it is; but we have been surprised before on this point, and so we continue our measurements. Why? Because based on the data depicted in Figures 1-5, reasonable projections of what would logically have been expected to happen next were all proven to be wrong. And we surely don't want to be fooled again, especially on so important a matter.
Truly, patience is a virtue ... and perseverance a necessity. Some questions just take a very long time to answer; and there are no short-cuts that can be taken. Even accepting an answer derived from an experiment that has run for a decade could ultimately turn out to have been a rush to judgment that was both incorrect and unwise, as shown by the results of our study as we progressed to the points in time represented by the six figures we have produced for this essay.
Wisdom and the pursuit of truth thus mandate that CO2 enrichment studies of trees may need to continue for 15 to 20 years if we are to be confident about what we ultimately will have to assume, i.e., that our final answer is indeed the correct answer.
| Sherwood, Keith and Craig Idso |
References
Idso, S.B. and Kimball, B.A. 1992. Aboveground inventory of sour orange trees exposed to different atmospheric CO2 concentrations for 3 full years. Agricultural and Forest Meteorology 60: 145-151.
Idso, S.B. and Kimball, B.A. 2001. CO2 enrichment of sour orange trees: 13 years and counting. Environmental and Experimental Botany 46: 147-153.
Idso, S.B., Kimball, B.A. and Allen, S.G. 1991. CO2 enrichment of sour orange trees: 2.5 years into a long-term experiment. Plant, Cell and Environment 14: 351-353.
Idso, S.B., Kimball, B.A. and Clawson, K.L. 1984. Quantifying effects of atmospheric CO2 enrichment on stomatal conductance and evapotranspiration of water hyacinth via infrared thermometry. Agricultural and Forest Meteorology 33: 15-22.
Kimball, B.A., Mauney, J.R., Guinn, G., Nakayama, F.S., Pinter Jr., P.J., Clawson, K.L., Reginato, R.J. and Idso, S.B. 1983. Effects of increasing atmospheric CO2 on the yield and water use of crops. Response of Vegetation to Carbon Dioxide, No. 21. U.S. Department of Energy, Washington, DC.