Reference
Esper, J., Büntgen, U., Timonen, M. and Frank, D.C. 2012. Variability and extremes of northern Scandinavian summer temperatures over the past two millennia. Global and Planetary Change 88-89: 1-9.
Description
The authors developed 587 high-resolution wood density profiles from living and sub-fossil Pinus sylvestris trees of northern Sweden and Finland to form a long-term maximum latewood density (MXD) record stretching from 138 BC to AD 2006, wherein all MXD measurements were derived from high-precision X-ray radiodensitometry, and where biological age trends inherent to the MXD data were removed using regional curve standardization, after which the new MXD record was calibrated against mean June-August temperatures obtained from the long-term (1876-2006) instrumental records of three different monitoring stations. And in comparing their results with the earlier temperature reconstructions of others, they say that their MXD-based summer temperature reconstruction "sets a new standard in high-resolution palaeoclimatology," as "the record explains about 60% of the variance of regional temperature data, and is based on more high-precision density series than any other previous reconstruction."
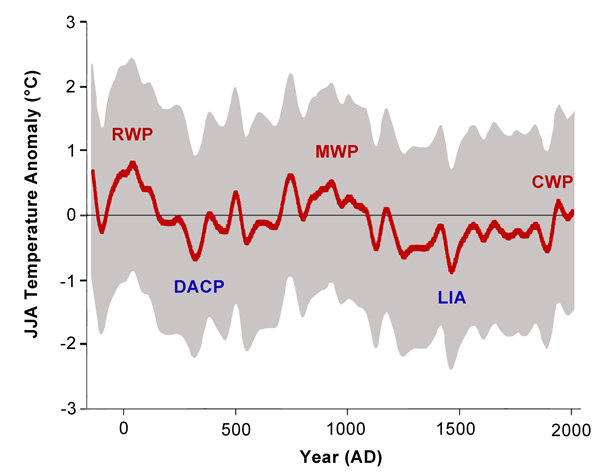
Finally, and most importantly, the four researchers state that their new temperature history "provides evidence for substantial warmth during Roman and Medieval times, larger in extent and longer in duration than 20th century warmth." More specifically, they identify the Medieval Warm Period as occurring between approximately AD 700 and 1300; and they identify the warmest 30-year interval of this period as occurring from AD 918 to 947, during which time June-August temperatures were approximately 0.3°C warmer than those of the warmest 30-year interval of the Current Warm Period.

Northern Scandinavian JJA temperatures shown with 100-year filters of the reconstruction (red curve) and uncertainty estimates integrating standard and bootstrap errors (shaded area). Text indicates the Roman Warm, Dark Ages Cold, Medieval Warm, Little Ice Age, and Current Warm Periods. Temperatures are expressed as anomalies with respect to the 1951–1980 mean.


