The Positive Externalities of Carbon Dioxide: Estimating the Monetary Benefits of Rising Atmospheric CO2 Concentrations on Global Food Production
Data
In order to calculate the monetary benefit of rising atmospheric CO2 concentrations on historic crop production, a number of different data sets were required. From the United Nations' Food and Agriculture Organization (FAO), annual global crop yield and production data were obtained, as well as the monetary value associated with that production (FAO, 2013). These data sources are published in the FAO's statistical database FAOSTAT, which is available online at http://faostat.fao.org/site/567/default.aspx#ancor.
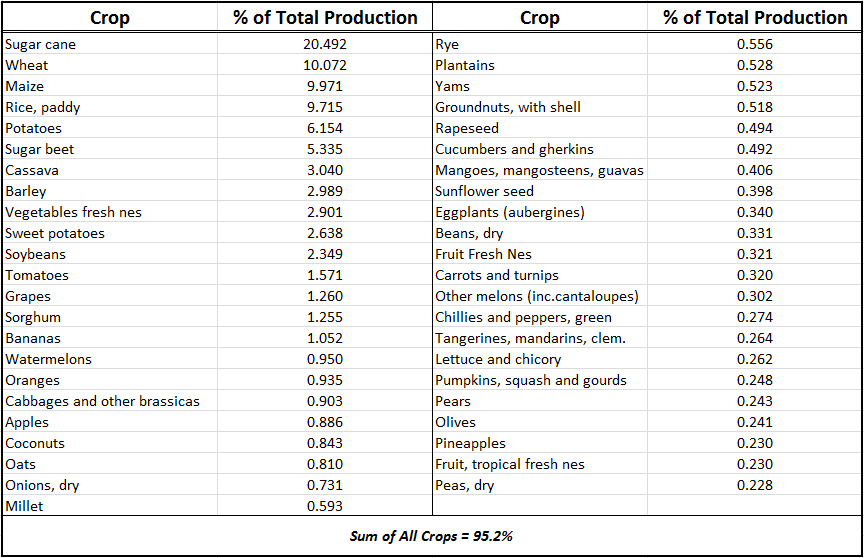
For the world as a whole, FAOSTAT contains data on these agricultural parameters for over 160 different crops that have been grown and used by humanity since 1961. No data are available prior to that time, so the temporal scope of this analysis was limited to the 50-year time window of 1961-2011. In addition, because more than half of the crops in the database each account for less than 0.1% of the world's total food production, it was deemed both prudent and adequate to further constrain this analysis to focus on only those crops that accounted for the top 95% of global food production. This was accomplished by taking the average 1961-2011 production contribution of the most important crop, adding to that the contribution of the second most important crop, and continuing in like manner until 95% of the world's total food production was reached. The results of these procedures produced the list of 45 crops shown in Table 1.

Other data needed to conduct the analysis were annual global atmospheric CO2 values since 1961 and plant-specific CO2 growth response factors. The annual global CO2 data were obtained from the most recent United Nations Intergovernmental Panel on Climate Change report, Annex II: Climate System Scenario Tables - Final Draft Underlying Scientific-Technical Assessment (IPCC, 2013). The plant-specific CO2 growth response factors - which represent the percent growth enhancement expected for each crop listed in Table 1 in response to a known rise in atmospheric CO2 - were acquired from the online Plant Growth Database of CO2 Science (Center for the Study of Carbon Dioxide and Global Change, 2013).
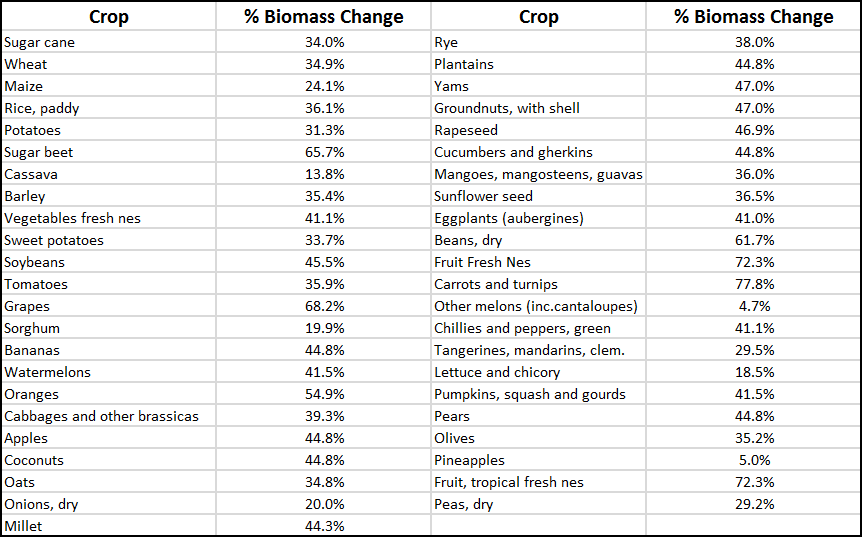
Located on the Internet at http://www.CO2science.org/data/plant_growth/plantgrowth.php, the CO2 Science Plant Growth Database lists the results of thousands of CO2 enrichment experiments conducted on hundreds of different crops growing under varying environmental conditions over the past few decades. This database was used to calculate the mean crop growth response to a 300-ppm increase in atmospheric CO2 concentration for each crop listed in Table 1. For some crops, however, there were no CO2 enrichment data contained in the database; and in those cases the mean responses of similar plants, or groups of plants, were utilized. Also, there were some instances where the plant category in the FAO database represented more than one plant in the CO2 Science Plant Growth Database. For example, the designation Oranges represents a single FAO crop category in the FAO database, yet there were two different types of oranges listed in the CO2 Science database (Citrus aurantium, and Citrus reticulata x C. paradisi x C. reticulata). Thus, in order to produce a single number to represent the CO2-induced growth response for the Oranges category, a weighted average from the growth responses of both orange species listed in the CO2 Science database was calculated. This procedure was repeated in other such circumstances; and the final results for all crops are listed in Table 2, which provides the average biomass response by FAO plant category for a 300-ppm increase in the air's CO2 concentration for all 45 crops listed in Table 1, which values are based upon data downloaded from the CO2 Science Plant Growth Database on 1 October 2013.


