


The Last 10,000 Years
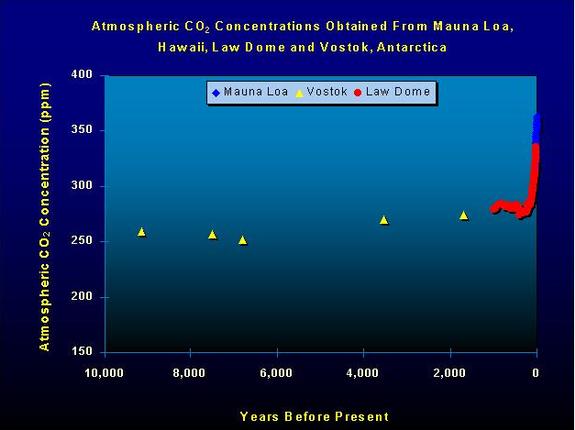 The accompanying figure depicts atmospheric CO2 concentrations over the past 10,000 years as measured directly at Mauna Loa, Hawaii (1958-present) and from reconstructed ice core data at Law Dome (1006-1969)and Vostok, Antarctica. Although there are large gaps between some of the data points in the record, it appears that the air's CO2 varied but little until the rapid rise of the last century or so.
To access a file of the data from which the graph was constructed, click here.
References
Boden, T.A., Kaiser, D.P., Sepanski, R.J. and Stoss, F.W. (Eds.). 1994. Trends '93: A Compendium of Data on Global Change. ORNL/CDIAC-65. Carbon Dioxide Information Analysis Center, Oak Ridge National Laboratory, Oak Ridge, Tennessee.
Etheridge, D.M., Steele, L.P., Langenfelds, R.L, Francey, R.J., Barnola, J.-M. and Morgan, V.I. 1998. Historical CO2 records from the Law Dome DE08, DE08-2, and DSS ice cores. In Trends: A Compendium of Data on Global Change. Carbon Dioxide Information Analysis Center, Oak Ridge National Laboratory, Oak Ridge, Tenn., U.S.A.
Keeling, C.D. and Whorf, T.P. 1998. Atmospheric CO2 concentrations -- Mauna Loa Observatory, Hawaii, 1958-1997 (revised August 1998). NDP-001. Carbon Dioxide Information Analysis Center, Oak Ridge National Laboratory, Oak Ridge, Tennessee.