


Volume 6, Number 19: 7 May 2003
In the 1 May 2003 edition of the American Association for the Advancement of Science's online Sciencexpress -- which provides a forum for the rapid electronic publication of certain papers that will subsequently appear in the hard-copy edition of Science, possibly with some intervening editorial changes -- Santer et al. (2003) compare the results of two different teams of scientists that have produced satellite-based tropospheric temperature trends with analogous results that they have produced with a state-of-the-art coupled atmosphere-ocean climate model. The two teams of scientists whose work is based on the satellite data are the University of Alabama at Huntsville (UAH) group, whose most recent work on the topic has also just been published (Christy et al., 2003), and the Remote Sensing Systems (RSS) group of Santa Rosa, California, whose most recent work on the topic is listed by Santer et al. as having recently been submitted for publication to the American Meteorological Society's Journal of Climate. The comparisons that Santer et al. consider cover the period from 1979 through 2001 (1999 for the climate model) and pertain to the mid-to-upper-troposphere, denoted T2 by Santer et al., and the lower stratosphere, which they represent by T4.
With respect to the lower stratospheric temperature (T4) trend, Santer et al.'s analysis indicates that all three approaches to obtaining that parameter produce essentially the same mean result over the period of record: a cooling on the order of 0.5°C per decade. However, as may be seen by even a cursory glance at their more detailed plots of monthly stratospheric temperature anomalies (see their Figure 1, Part A, which we reproduce below), many of the monthly climate-model-derived temperature anomalies are vastly different from the much more similar and tightly-coupled monthly satellite-derived temperature anomalies. In many places, in fact, the two sets of satellite-derived temperature anomalies are almost indistinguishable from each other, differing by mere hundredths -- if not thousandths -- of a °C. The differences between the climate-model-derived temperature anomalies and those of either of the two sets of satellite-derived temperature anomalies, on the other hand, are often on the order of several tenths of
a °C.
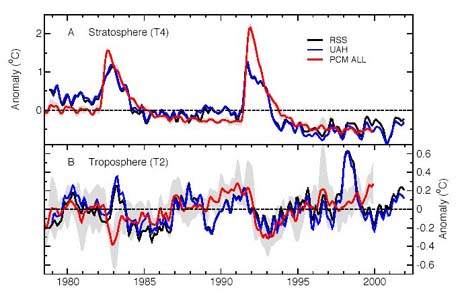
Figure 1. Time series of satellite-derived (RSS and UAH) and climate-model-derived (PCM ALL) monthly temperature anomalies (relative to their respective grand means over the period 1979 to 1999) for the lower stratosphere (T4, Part A) and the mid-to-upper-troposphere (T2, Part B). Adapted from Santer et al. (2003).
These observations are extremely important, for they demonstrate -- right from the start, and for the part of the atmosphere that is the easiest to model (the lower stratosphere) -- that the climate-model-derived temperature anomaly of Santer et al. is much too crude to ever be used to do what they attempt to do with it, i.e., employ it as a sensitive tool to determine which of the two extremely similar satellite-derived temperature records is the more correct. This fact should be obvious when it is realized that the true temperature history of the lower stratosphere must be extremely close to that of either the RSS or UAH plot of Figure 1, since these two plots are based on real-world data. And since they themselves are so very similar, there is no way that the vastly different climate-model-derived simulations (PCM ALL) of Santer et al. could possibly be used to determine which of these ever-so-slightly-divergent satellite-derived temperature anomaly plots is the more correct of the two.
Dropping down to the mid-to-upper-tropospheric (T2) region, which is the region with which nearly everyone associated with the issue is most concerned, this same quantitative difference between the climate-model-derived temperature anomaly and the two satellite-derived temperature anomalies is again evident in many parts of the record. In this region, however, there is an additional qualitative difference between the climate-model-derived and satellite-derived data sets; and that difference is even more disturbing than the quantitative difference.
At one point in the early part of the record (around 1983: see Figure 1, Part B), for example, both of the real-world satellite-derived temperature anomalies rise by nearly four-tenths of a °C over a period of several months, while over essentially the same time period the climate-model-derived simulated temperature anomaly does just the opposite and actually drops by that amount. Then, at the points where these trends terminate and the satellite-derived anomalies differ from the climate-model-derived anomaly by a full 0.7°C, the trends reverse; and the two satellite-derived temperature anomalies rapidly decline, while the climate-model-derived temperature anomaly rises, again doing just the opposite of what the satellite-derived temperature anomalies do ... which poses an interesting question: How can something that behaves just the opposite of two other things, which are tightly coupled and vary hand-in-hand with each other, possibly be used to determine which of those other two things best represents what they claim they measure?
A few years later (around 1989: see again Figure 1, Part B), the two satellite-derived temperature anomalies go off in the other direction in a near-perfect hand-in-hand decline that ultimately lowers them about 0.4°C. The climate-model-derived temperature anomaly, however, makes essentially no decline at all. And in a third example of dissimilar behavior, near the end of the record (around 1998), the two satellite-derived temperature anomalies once again rise, this time by a full 0.7°C, while the climate-model-derived temperature anomaly rises by only 0.1°C, and then goes on to rise another 0.1°C while the satellite-derived temperature anomalies fall all the way back to where they were when they began their rapid rise.
These tremendous differences in both qualitative and quantitative behavior between the satellite- and climate-model-derived temperature anomalies of Figure 1 demonstrate once again -- and this time for the critical troposphere -- that the simulated climate-model-derived temperature history of Santer et al. cannot possibly be used to determine which of the real-world satellite-derived temperature histories is the more correct of the two. Nevertheless, Santer et al. conclude the abstract of their paper, seemingly oblivious to these considerations, by saying that their findings "show that claimed inconsistencies between model predictions and satellite tropospheric temperature data (and between the latter and surface data) may be an artifact of data uncertainties [our italics]."
This conclusion is almost laughable, and it indeed would be if the topic it addressed was not so serious; for it should be crystal clear to nearly every thinking person that if there are any major artifacts or uncertainties in the three temperature records that Santer et al. compare, they reside in the record produced by the climate model they employ. Yet Santer et al. use this demonstrably-inadequate tool (a crude hatchet, as it were) to differentiate between two tightly-coupled-and-almost-inseparable satellite-derived temperature records (an exercise in splitting hairs, as it were) to supposedly determine which of them is the more correct. This assessment simply cannot be made on that basis.
| Sherwood, Keith and Craig Idso |
References
Christy, J.R., Spencer, R.W., Norris, W.B., Braswell, W.D. and Parker, D.E. 2003. Error estimates of version 5.0 of MSU-AMSU bulk atmospheric temperatures. Journal of Atmospheric and Oceanic Technology 20: 613-629.
Santer, B.D., Wigley, T.M.L., Meehl, G.A., Wehner, M.F., Mears, C., Schabel, M., Wentz, F.J., Ammann, C., Arblaster, J., Bettge, T., Washington, W.M., Taylor, K.E., Boyle, J.S., Bruggemann, W. and Doutriaux, C. 2003. Influence of satellite data uncertainties on the detection of externally forced climate change. Sciencexpress/ www.sciencexpress.org /1 May 2003.