


The Last 1,000 Years
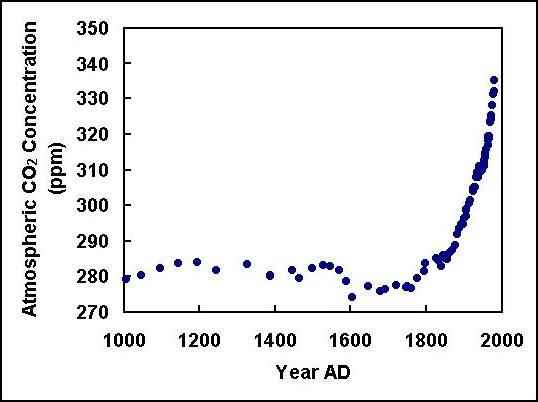
 The accompanying figure depicts the value of earth's atmospheric CO2 concentration over the last millennium, as reconstructed from ice core data obtained by Etheridge et al. (1998) at Law Dome, Antarctica. The graph shows the near constancy of the air's CO2 content over most of the thousand years, with a dramatic increase over the last century or so that is typically attributed to the accelerated burning of fossil fuels that accompanied the human population explosion over that period (Idso, 1989).
 The accompanying figure depicts the value of earth's atmospheric CO2 concentration over the last millennium, as reconstructed from ice core data obtained by Etheridge et al. (1998) at Law Dome, Antarctica. The graph shows the near constancy of the air's CO2 content over most of the thousand years, with a dramatic increase over the last century or so that is typically attributed to the accelerated burning of fossil fuels that accompanied the human population explosion over that period (Idso, 1989).
To access a file of the data from which the graph was constructed, click here.
References
Etheridge, D.M., Steele, L.P., Langenfelds, R.L, Francey, R.J., Barnola, J.-M. and Morgan, V.I. 1998. Historical CO2 records from the Law Dome DE08, DE08-2, and DSS ice cores. In Trends: A Compendium of Data on Global Change. Carbon Dioxide Information Analysis Center, Oak Ridge National Laboratory, Oak Ridge, Tenn., U.S.A.
Idso, S.B. 1989. Carbon Dioxide and Global Change: Earth in Transition. IBR Press, Tempe, AZ.